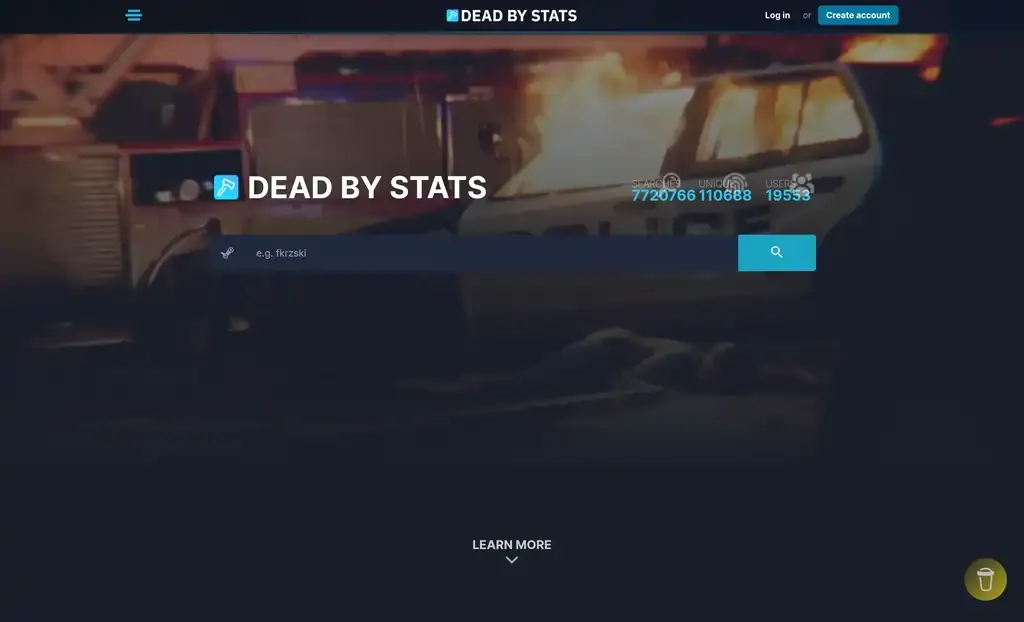
Overview
Dead by Stats is a statistics tracker for Dead by Daylight — a multiplayer horror game whose match telemetry the game itself never shows players in any usable form. Paste in any public Steam profile and you get back 190+ tracked in-game stats, daily progression charts, per-statistic leaderboards, and side-by-side player comparisons. No account needed for a lookup.
It started in autumn 2021 as a school project with a classmate. Five years and four versions later it has 21,408 registered users and has handled 8.9 million searches. Display ads and reader support cover the VPS, the domain and the SSL, with a small surplus.
On 17 June 2025 Behaviour, the studio behind the game, shipped an official stats tracker. Growth flatlined and the site sat in maintenance until May 2026, when I took it out again. The three months since have been the most productive stretch in its history — and contain the most expensive mistake I have made in production.
What it does
A first-time visitor lands on the homepage, pastes a Steam profile URL or ID, and has stats back within seconds.
- 190+ tracked stats pulled live from any public Steam profile — kills, escapes, generators repaired, killer-specific mastery, and the rest of what Dead by Daylight records. Lookups are anonymous.
- Save Your Progress (Steam-linked account required) — a daily snapshot of your stats, plotted over time on interactive charts.
- Leaderboards — every ranked statistic gets its own page, plus a position finder that tells you where a given player sits without paging through the table.
- Head-to-head comparison — two players, numbers side by side.
- Badges and Discord linking — optional, opt-in, and the only place the site asks for anything beyond a Steam ID.
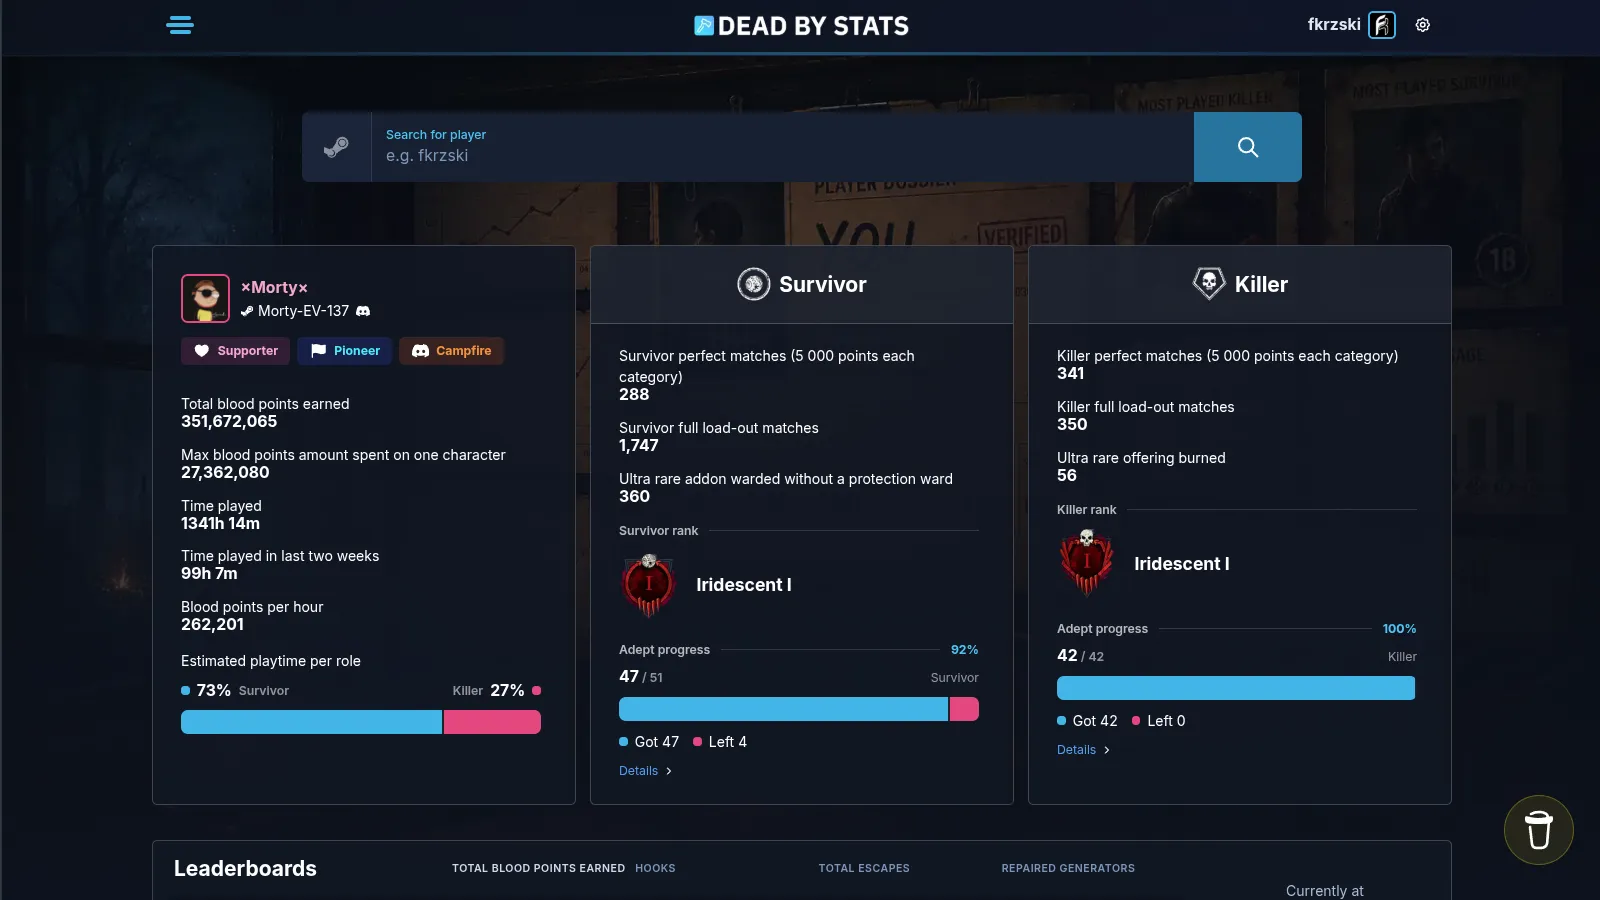
A player profile — identity card with badges, then survivor and killer broken out side by side.
Team and my role
The idea came out of conversations with Dominik Misiek, a classmate from technical school, in late 2021. He owned the frontend on v1 and v2 and reviewed my frontend work there; I owned the backend, the Steam integration, deployment, the VPS, the domain and the mail infrastructure from day one. By v3 his involvement had narrowed to code review on my rewrite. Since v4 in October 2024 I have maintained the whole thing alone — backend, frontend, DevOps and design.
Five years, four versions
Every version had a concrete reason and a measurable outcome.
| Version | What changed | Outcome |
|---|---|---|
| v1 — autumn 2021 | Vanilla PHP, JS and HTML. Hand-written router, four pages, ~30 stats. | A school project on free hosting. |
| v2 — October 2022 | React on a Laravel API. A real VPS, deadbystats.eu, mail infrastructure, every in-game stat, Save Your Progress. |
The JS-rendered frontend capped us at Google positions 5–10. |
| v3 — October 2023 | React → Blade monolith. Steam OAuth as the only signup path, GitHub Actions deploys, ECR image versioning, a CI suite. | Positions 1–4 before any new SEO work. |
| v4 — October 2024 | Solo maintenance and a redesign. /changelog, and an admin panel for editing FAQ and policies without a deploy. |
Dominik stepped away. Now at 4.15.0. |
Two of those are worth a footnote. On v2, Dominik arrived with full Figma designs and a proposal to rewrite in React; we landed on React plus Laravel because Save Your Progress couldn’t live in the browser and Steam blocks direct browser-side calls. On v3, the rewrite took longer than learning React properly would have — I did it anyway, because the SEO penalty was capping growth and I did not want to be left alone with a codebase I never wrote.
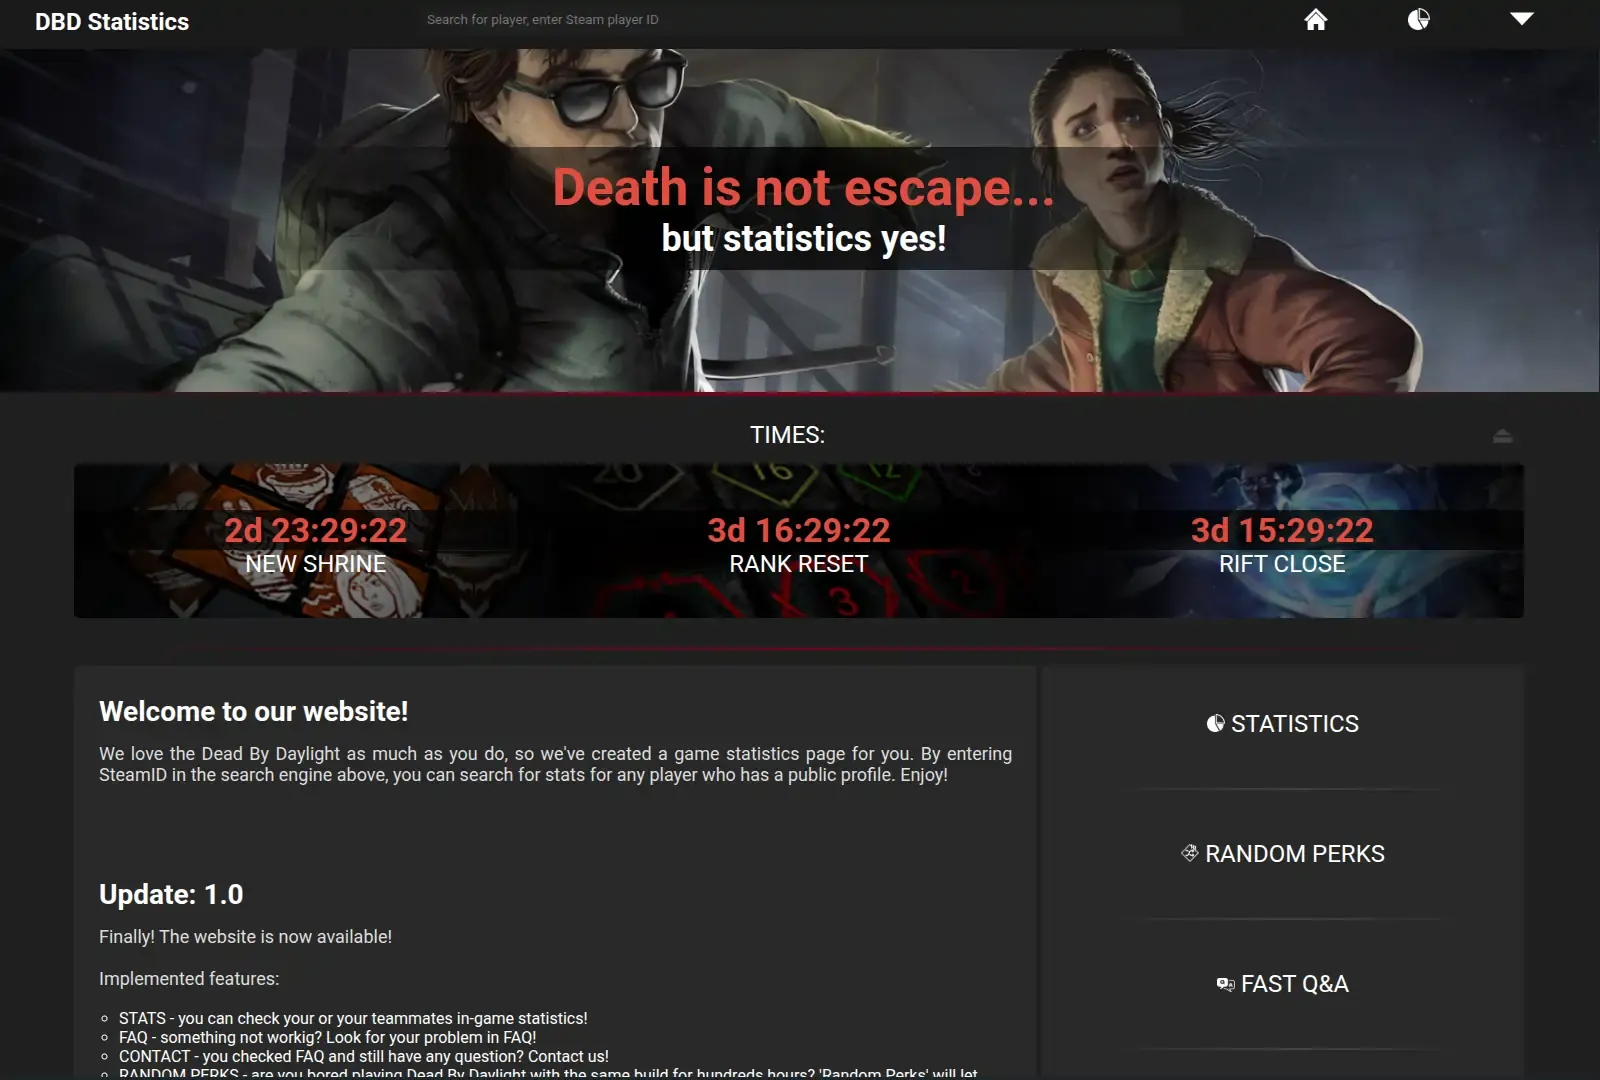
The v1 source is still public as DMFK-Dev/DBD-Statistics.
The SEO bet
Rewriting a React frontend into a Blade monolith in 2023 sounds like regression. It wasn’t.
Before v3, despite real SEO effort, our average Google position for target keywords sat at 5–10. The rewrite alone — before any new SEO work — moved it to 1–4. Dedicated optimisation on the new architecture took it to an average position of 2.3 on Google and 1.4 on Bing.
The trade-off is real: development velocity on highly interactive features is lower in Blade and Livewire than in React. For a read-mostly stats site that was the right trade.
What I did not appreciate at the time is that the bet had a second payoff waiting three years out.
The 2026 growth round
After 4.9.9 shipped in November 2025 the project went quiet for six months. It came back with 4.10.0 on 25 May 2026, and 17 releases landed in the next ten weeks.
The first thing I did was not a feature. It was a measurement baseline: GA4, Search Console and Cloudflare side by side, and a decision about which of them I would treat as the truth. Cloudflare reported roughly forty times more visitors than GA4, because most of what Cloudflare sees is crawlers. Every decision after that used GA4 for humans and Search Console for reach.
The baseline turned up one number that settled the priorities on its own: 562,000 search impressions against 8 indexed pages. Google was showing the homepage to an enormous audience and had almost nothing else to show. The site had thousands of players’ worth of data and was exposing none of it as pages.
So that is what the round went after — indexable surface. Every ranked statistic got its own leaderboard
page. Player profiles became indexable, with the sitemap restricted to profiles someone had actually
visited so it wouldn’t fill with dead URLs. Canonical URLs, a real robots.txt, and llms.txt went in.
Indexed pages, from Search Console:
| Date | Indexed |
|---|---|
| 12 June 2026 | 8 |
| 1 July 2026 | 275 |
| 11 July 2026 | 1,222 |
| 25 July 2026 | 2,142 |
Search traffic followed. Across 7 May – 4 August 2026, Google sent 33,708 clicks on 826,298 impressions; daily clicks went from 103 in the first week of that window to 498 in the last, and average position from 6.4 to 4.4. Bing moved the same way, from 9 to 25 clicks a day. Weekly active users in GA4 went from roughly 530 to roughly 1,350.
Two things about that I want to state plainly, because the numbers flatter more than the situation deserves. Google discovered 18,635 pages it has not indexed — generating URLs is cheap and getting them indexed is not. And 96% of clicks still land on the homepage: the leaderboard pages exist, they rank, and they are not yet where the traffic is.
This is also the part where the 2023 rewrite pays out again. Thousands of server-rendered pages generated from data already in the database is exactly the move a Blade monolith makes cheaply and a SPA does not.
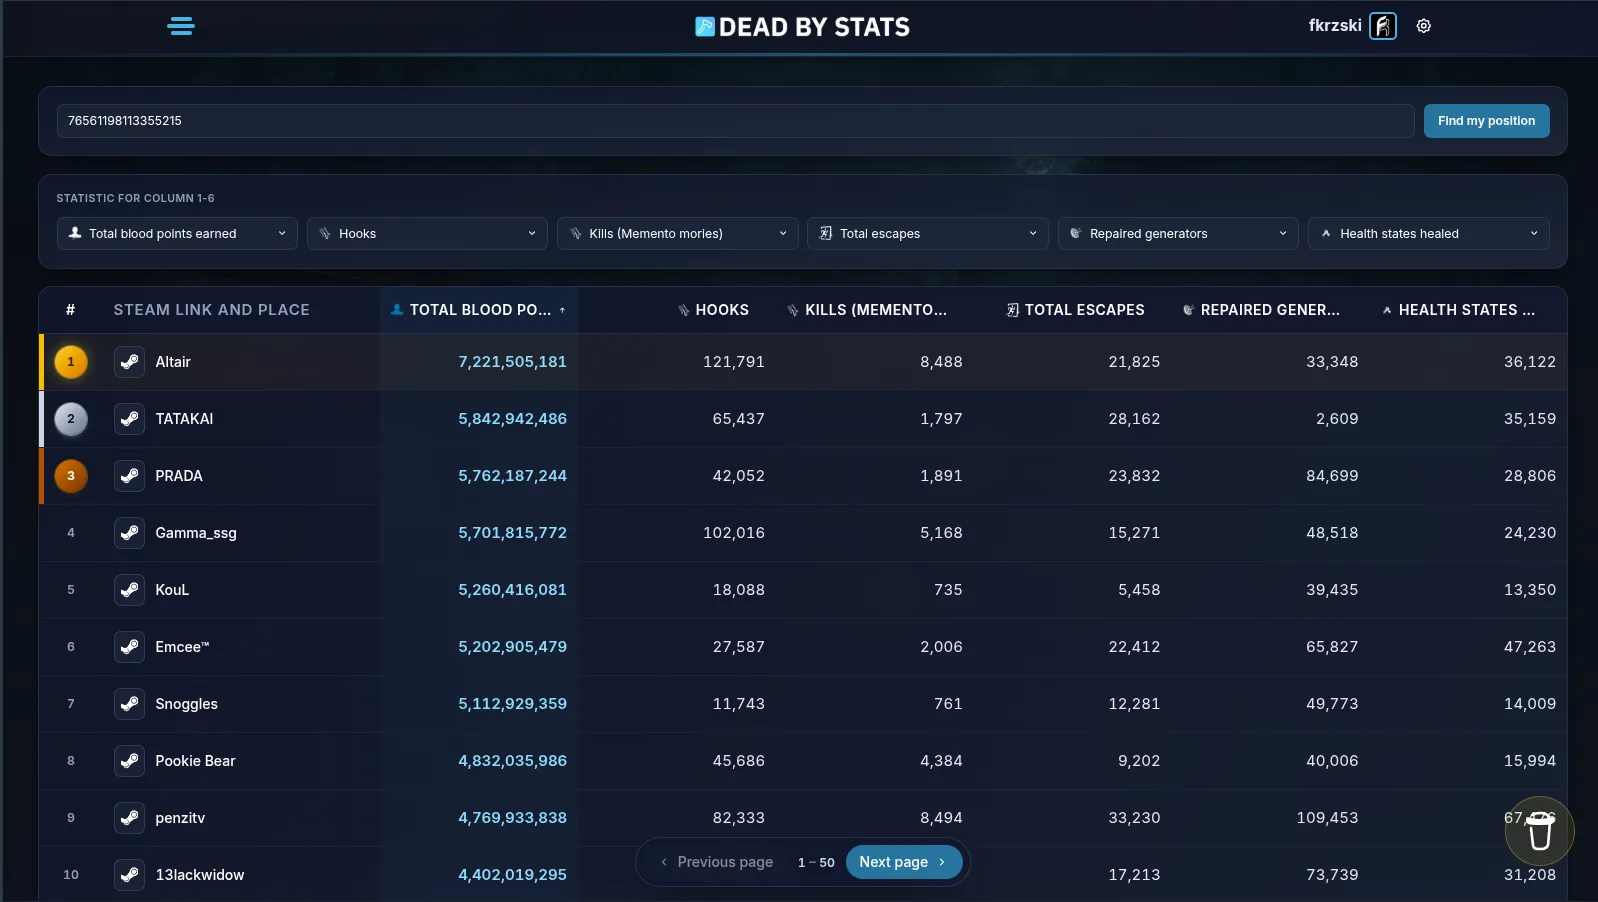
The leaderboard hub — position finder and six configurable stat columns. Every ranked statistic also gets its own page, which is where the indexable surface came from.
Engineering challenges
Save Your Progress at scale
At 100 users the daily snapshot job was a single synchronous run on the scheduler and it worked. At a few hundred it timed out, leaving records stale. Past a thousand it would intermittently take the server down. The bottleneck was not Steam’s rate limit — it was a batch job pretending to be a cron tick, holding a request thread for minutes.
The fix was discovering Laravel’s queue system properly: one job per user, each independently retryable, with the scheduler reduced to enqueuing work. The server stopped dying.
Steam’s API: fragmented data, one shared quota
A complete profile means hitting three separate Steam endpoints — profile, owned games and playtime, per-game achievement stats. Most of that barely changes hour to hour, and all of it draws on the same per-key quota. With Save Your Progress and comparisons multiplying request volume, we hit the ceiling on a small player base.
The answer was a per-endpoint Redis cache on a 15–20 minute TTL, matching Steam’s own refresh cadence: fresher-or-equal data for a fraction of the upstream calls.
Making profiles indexable in 2026 reopened the problem from the other side. Crawlers now request profiles too, and a crawler is perfectly happy to walk thousands of them. Three guards went in: crawler traffic is served without competing with real visitors for Steam data, profile lookups and OG cards get their own rate limits, and the route pattern rejects malformed Steam IDs before they can spend a vanity-URL resolution — because an unrecognised string is handed straight to Steam, and the quota is shared by the whole site.
Leaderboards: 15 seconds to 1.1
Many rows, many columns, many sort and filter combinations. The naive implementation took roughly 15 seconds to render. Caching the hot result sets, adding composite indexes on the columns actually sorted on, and killing the worst N+1 queries on player lookups brought it to about 1.1 seconds — a ~14× improvement on a page whose access pattern is bursty rather than constant.
Open Graph cards as a Node sidecar
Every profile and leaderboard needed a share image, generated from live data. That runs as a small Node service alongside Laravel: satori renders JSX to SVG, resvg rasterises it to PNG, and Laravel talks to it over a Unix socket. It runs TypeScript directly on Node’s built-in type stripping, so there is no build step to keep in sync.
Two problems were worth the trouble of writing down.
Steam nicknames are not Latin. A card for a Japanese, Korean, Thai, Hebrew, Devanagari or Arabic-script name renders as tofu unless the font stack covers it, so the service ships subsetted fonts for each and picks per name.
And the cards were not being cached. The routes sat inside the web middleware group, so every response
carried a session and an XSRF cookie — and a CDN will not cache a response with Set-Cookie on it. The
s-maxage the controller set bought nothing; every crawler fetch reached origin, and every one of them
also wrote a Redis session nobody would ever come back for. Taking session, CSRF and cookie middleware off
those two routes fixed both problems at once. Crawlers have no session to keep.
Keeping the leaderboards honest
Public leaderboards built on self-reported game telemetry attract manipulated profiles. Rather than policing by hand, the site flags profiles whose numbers are internally impossible — a prestige level above 100, more basement chests opened than chests total, more than 85 pips, a single heal statistic exceeding total health states healed. Flagged profiles still render, with a warning, but are excluded from the rankings.
Bot Fight Mode: three days, one quarter
On 5 August 2026 I turned on Cloudflare’s Bot Fight Mode. I read the name, assumed it was about spam, and did not read the description. It blocks Googlebot.
Search Console, against a 1–4 August baseline of 476 clicks and 10,031 impressions a day:
| Date | Clicks | Impressions | Avg. position |
|---|---|---|---|
| 5 Aug (enabled) | 118 (25%) | 3,143 (31%) | 5.5 |
| 6 Aug | 27 (6%) | 1,199 (12%) | 7.7 |
| 8 Aug (disabled) | 21 (4%) | 1,110 (11%) | 7.2 |
| 10 Aug | 16 (3%) | 1,275 (13%) | 7.3 |
| 12 Aug | 255 (54%) | 6,234 (62%) | 4.1 |
I noticed on the third day. Coverage had already flagged 961 pages as blocked by a 403 plus 284 server errors, and indexed pages had started to slip. GA4 agreed: daily active users down 63%, organic sessions down 68%.
Three details are worth more than the numbers.
The damage and the recovery are not symmetric. Traffic collapsed inside 24 hours. A week after switching it off it was back to roughly half. The quarter of SEO work that got clicks from 103 a day to 498 was undone by one toggle in an afternoon.
Bing never noticed — 24.9 clicks a day before, 24.4 during. If one search engine falls off a cliff and another doesn’t, the problem is your infrastructure, not your content. That divergence is the fastest diagnostic I have found and I did not think to look at it for three days.
Catching it in three days is why there is still a site to talk about. Indexed pages went from 2,142 to 2,040 — a 5% dip, not a wipeout. The traffic was gone long before the index was, and the index is the part that takes months to rebuild.
What came out of it
Two packages were extracted from this codebase during the 2026 round and released on their own, because the same Steam integration kept getting copy-pasted between projects:
- php-steam-api-sdk — a framework-agnostic Steam Web API client.
- laravel-steam-api-sdk — the Laravel integration on top of it.
Dead by Stats now consumes both as dependencies, which means the API surface has to be good enough for someone who is not me.
Stack and quality tooling
Runtime: PHP 8.5 · Laravel 13 · Livewire 4 with Blaze · FrankenPHP + Laravel Octane · Horizon · MySQL · Redis · Filament 5 for the admin panel · Tailwind CSS 4 with Vite · Turnstile · Nightwatch · a Node sidecar for OG cards.
Quality: Pest 5 (migrated off PHPUnit), ~650 tests across 146 files, architecture tests enforcing the layer boundaries, mutation testing at a 100% MSI threshold on a nightly run, 100% type coverage, test impact analysis for fast feedback on a changed file, Larastan at level 5, Pint, Rector, and five GitHub Actions workflows covering tests, mutation, security, Docker and deploy.
The first list is what the app is built from. The second is how it survived 3,005 commits and 62 releases across five years, most of them written by a single person who is regularly away from the code for weeks. The second list matters more.
Results
Application totals as of 13 August 2026:
- 21,408 registered users
- 8,901,545 searches handled
- 120,874 unique players looked up
- ~1,350 weekly active users before the Bot Fight Mode incident, per GA4
Search visibility, 7 May – 4 August 2026 (Google): 33,708 clicks on 826,298 impressions, 4.08% CTR, average position 4.4. Mobile and desktop are near-even at 17,396 and 16,194 clicks. Top markets: United States 38%, United Kingdom 10%, Germany 6%. Bing, same window: 2,094 clicks on 86,608 impressions.
Worth comparing against the numbers this case study used to quote from the pre-Behaviour peak: average position was better then (2.3) than it is now (4.4), and yet the site gets roughly three times the search traffic. Ranking near the top of a handful of head terms is worth less than ranking mid-first-page across thousands of pages.
Economics. Self-sustaining. Display ads and reader support cover the VPS, the domain and the SSL with a small surplus. It has never run at a loss.
Reliability. Five years in production and no unplanned outage longer than a few minutes since v3 shipped. The one outage-shaped event in that time was self-inflicted and is documented above.
What I’d do differently
- Never enable a feature on Cloudflare — or anywhere else — without reading its full description. Not the name, not the tooltip. The description. Bot Fight Mode cost a quarter of SEO work in an afternoon, and I had every piece of information needed to avoid it before I clicked.
- Wouldn’t go headless just to get a fast frontend. Losing maintainability when Dominik stepped away, plus two years of SEO penalty, outweighed the velocity.
- Would have gone to Docker, FrankenPHP and Octane far earlier. They are all in production now and the performance and DX gains are large enough that the upfront learning would have paid for itself by v2. I got there by drifting rather than deciding.
- Would write more modular code. I believed I’d remember my own code blindfolded. One month away from a
module and I’m reading
git blamelike everyone else. - Would have migrated to Tailwind years earlier. The custom
dbs-button/dbs-linksystem Dominik and I co-built actively blocked the v4 redesign until it was replaced — and by then its original author had moved on. - Would have built indexable content before Save Your Progress. SYP was meant to drive monetisation but shipped before anyone knew the site existed. The 2026 round is, in large part, doing in retrospect what should have come first.
Status today
Actively developed, at 4.15.0. The current work is rebuilding search visibility after the Bot Fight Mode incident — as of 12 August, clicks are back to 54% of where they were and impressions to 62%.
Five years, four versions, one very cheap-looking toggle. Still live, still paying for itself, still mine.
